
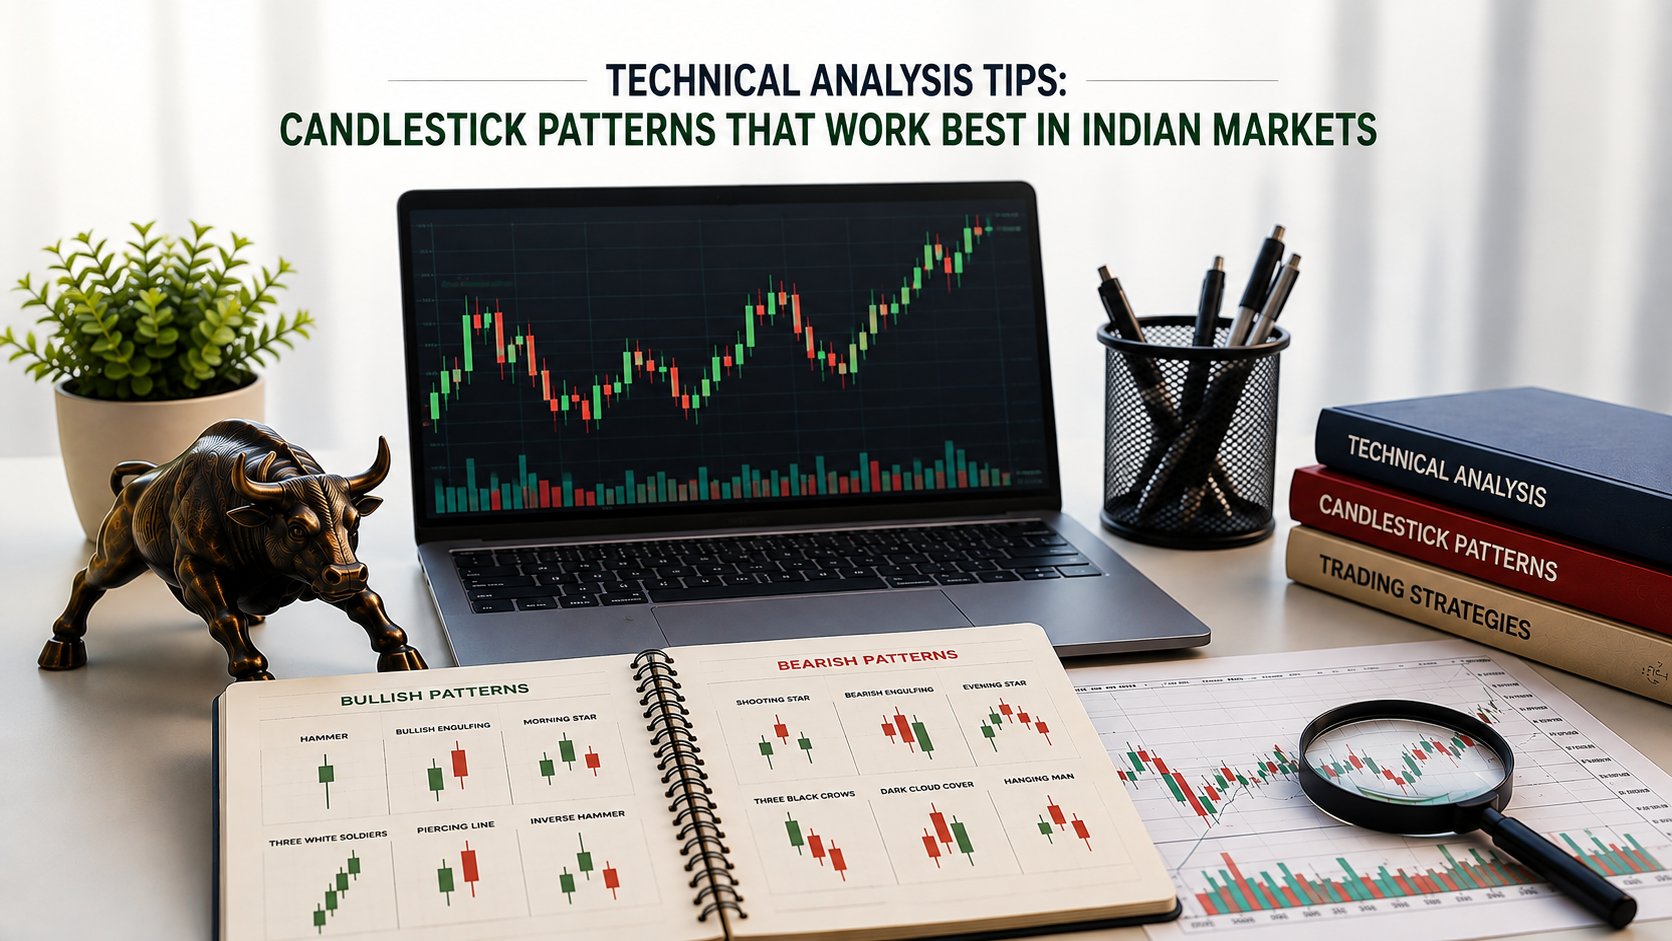

Indian stock market traders are increasingly relying on chart-based strategies to make better trading and investing decisions. Whether you are a beginner or an experienced trader, understanding Technical Analysis Tips can help identify market trends, improve entry and exit timing, and manage risk more effectively. In this blog by Money Times, we will explore the candlestick patterns that tend to work best in Indian market conditions and how they can be combined with broader Stock Market Analysis India strategies.
Why Candlestick Patterns Matter in Indian Markets
Candlestick charts represent price action visually and provide insights into market sentiment. Since Indian markets often react sharply to economic announcements, global cues, and domestic policy updates, candlestick patterns can help traders interpret short-term momentum more accurately.
A strong understanding of Technical Analysis Basics allows investors to identify potential reversals, breakouts, and continuation trends without relying solely on market news.
Technical Analysis Basics Every Investor Should Know
Before using candlestick patterns, it is important to understand the four key components of a candlestick:
- Open Price
- High Price
- Low Price
- Close Price
The body of the candle shows the difference between opening and closing prices, while the wicks indicate intraday highs and lows. In Stock Market Analysis India, traders often use daily and weekly candlestick charts because they filter out excessive market noise and provide clearer signals.
Top Candlestick Patterns That Work Well in Indian Markets
1. Bullish Engulfing Pattern
This pattern forms when a small bearish candle is followed by a larger bullish candle that completely engulfs the previous candle’s body.
Why it works in India: It is especially effective after a sharp market correction or during strong recovery phases when buying interest returns.
Trading tip: Wait for confirmation from the next candle and increased trading volume before entering a position.
2. Hammer Pattern
A hammer has a small body and a long lower wick, indicating that sellers pushed prices lower but buyers regained control before the session closed.
Best use: Near important support levels or after a prolonged decline.
This is one of the most reliable Technical Analysis Tips for identifying potential trend reversals in volatile Indian market sessions.
3. Morning Star Pattern
The Morning Star is a three-candle reversal pattern consisting of:
- A bearish candle
- A small indecisive candle
- A strong bullish candle
Why traders prefer it: It reflects a clear shift from selling pressure to buying momentum and is widely used in Stock Market Analysis India for swing trading opportunities.
4. Doji Pattern
A Doji forms when the opening and closing prices are nearly equal, signaling indecision between buyers and sellers.
Important note: A Doji alone is not enough for a trading decision. It becomes powerful when it appears near support or resistance zones and is confirmed by subsequent price action.
5. Shooting Star Pattern
This pattern has a small body with a long upper wick and usually appears after an uptrend.
What it indicates: Buyers attempted to push prices higher, but sellers eventually dominated the session.
In Stock Market Today India, such patterns are often closely watched during periods of strong market rallies or overextended price moves.
Combining Technical and Fundamental Analysis
While candlestick patterns are useful, they should not be used in isolation. A balanced approach combines Technical Analysis Basics with a Fundamental Analysis Guide.
Key fundamental factors to monitor:
- Corporate earnings growth
- Interest rate trends
- Inflation data
- Government policy announcements
- Sector-specific economic developments
Technical analysis helps determine when to enter or exit, while fundamental analysis helps determine what is worth investing in for the long term.
Practical Technical Analysis Tips for Indian Traders
Use Multiple Time Frames
Check the weekly chart for the primary trend and the daily chart for entry opportunities. This reduces the chances of trading against the broader market direction.
Focus on Support and Resistance
Candlestick patterns become significantly more reliable when they appear near:
- Previous swing highs or lows
- Round-number price zones
- Long-term trend lines
- Consolidation breakouts
Confirm with Volume
A bullish reversal accompanied by higher-than-average volume generally has a greater probability of success than a pattern formed on weak volume.
Avoid Overtrading
Many beginners try to trade every candlestick pattern they see. One of the best Investment Tips India is to wait for high-quality setups that align with the overall market trend.
Candlestick Patterns for Long-Term Investors
Candlestick analysis is not only for short-term traders. Investors involved in stock market investment in India can use weekly and monthly candlestick charts to improve long-term entry timing.
For example:
- A Bullish Engulfing on a weekly chart may indicate the beginning of a medium-term uptrend.
- A Hammer near a long-term support zone can help investors accumulate gradually instead of investing all funds at once.
This approach can improve risk-adjusted returns without requiring constant monitoring of intraday market movements.
Role of Technical Analysis During IPO Investing
Investors often focus entirely on company fundamentals during public offerings, but technical analysis can also be useful after listing. An IPO Investment Guide India should include both valuation analysis and post-listing price behavior.
Watching early candlestick formations can help investors:
- Identify strong demand after listing
- Avoid entering during excessive volatility
- Wait for stable support zones to develop before making additional investments
This combination of technical and fundamental analysis provides a more disciplined IPO investment approach.
Conclusion:
Successful trading and investing require discipline, patience, and a structured strategy. The most effective Technical Analysis Tips are those that combine reliable candlestick patterns with broader Stock Market Analysis India techniques and sound risk management principles.
For readers of Money Times, the key takeaway is that Technical Analysis Basics should be viewed as a practical decision-making tool rather than a shortcut to guaranteed profits. When combined with a strong Fundamental Analysis Guide, regular monitoring of Stock Market Today India, and disciplined stock market investment in India practices, candlestick patterns can become a valuable part of a well-rounded investment strategy.
By applying these Investment Tips India consistently and using insights from an IPO Investment Guide India, investors can make more informed decisions and navigate Indian market conditions with greater confidence and clarity.
Click here to know more about “Budget 2026 Impact on Market: What Investors Should Prepare For.“


Leave A Comment