


30 October 2026 | 8:29 AM IST
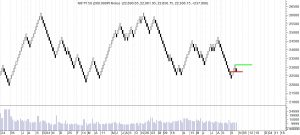
Latest Displayed Renko Value: 22,936.75
Chart Change: +237.900
Key Levels from the Chart
Resistance / Bullish Confirmation: 23,150–23,200
The green horizontal line is near 23,150. A confirmed Renko reversal followed by a move above this level would improve the recovery outlook.
Immediate Support / Decision Level: 22,700–22,750
The red horizontal line is near 22,750. A break below this zone would weaken the recent rebound.
Interpretation
- Primary trend: The broader Renko structure remains bearish, with lower swing highs following the earlier decline.
- Current setup: A rebound has emerged from the recent low around 22,300–22,400, but a confirmed trend reversal has yet to emerge.
- Bullish scenario: A sustained move above 23,150–23,200 could open the way towards 23,400, followed by 23,600.
- Bearish scenario: A break below 22,700–22,750 could expose the recent swing low around 22,300–22,400.
Trading Decision
My preference is to wait for confirmation rather than chase the rebound. The green level represents the upside confirmation zone, while the red level is the downside decision zone. These should be treated as approximate chart levels, not guaranteed execution prices.


Leave A Comment