


28 October 2026 · 12:56 PM IST · TradingView · OANDA
Current Price: 4,035.380 USD/oz
Immediate Resistance: 4,038–4,040
Breakout Zone:
1. Price Structure:
- Gold has declined sharply from the 4,060–4,065 region.
- The price is now attempting a rebound around 4,033–4,035 after testing the 4,030 level.
- Short-term moving averages are sloping downward, indicating that the recovery has not yet confirmed a trend reversal.
- The 4,038–4,040 zone is the immediate hurdle. A sustained move above this range would improve the recovery outlook.
2. Order Flow and Momentum:
- The histogram indicates that selling momentum remains dominant, although the negative bars appear to be contracting.
- The momentum signal line is turning upward from deeply negative territory, suggesting that selling pressure may be easing.
- The Relative Strength Index (RSI) is recovering from near the oversold region but remains weak.
- These signals suggest a potential technical rebound, but do not yet confirm a bullish reversal.
Key Trading Levels:
| Gold Price (USD) | Interpretation |
|---|---|
| 4,048–4,052 | Higher recovery resistance |
| 4,038–4,040 | Immediate breakout hurdle |
| 4,034–4,035 | Current price and decision zone |
| 4,030–4,032 | Immediate support |
| 4,020 | Next downside reference if support breaks |
Trading Scenarios:
Bullish Recovery
A sustained break above 4,038–4,040, followed by the price holding above this zone, could open the way for a move towards 4,048–4,052. Stronger buying confirmation is required.
Bearish Continuation
If the rebound fails near 4,038–4,040 and the price breaks below 4,030 on a sustained basis, downside pressure may resume, potentially taking gold towards 4,020.
Technical Conclusion
Gold is attempting a rebound after a sharp decline, with early signs of easing selling momentum. However, the hourly trend remains weak as long as the price stays below the falling moving averages. The decisive level is 4,040, and a confirmed move above it is necessary before the recovery can be considered a stronger bullish move.
This assessment is based on the supplied chart screenshot. The levels are approximate, and the current hourly candle is still forming.
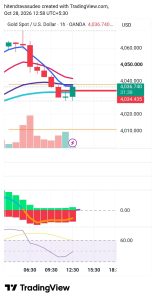
Green buyer order flow still not strong


Leave A Comment