
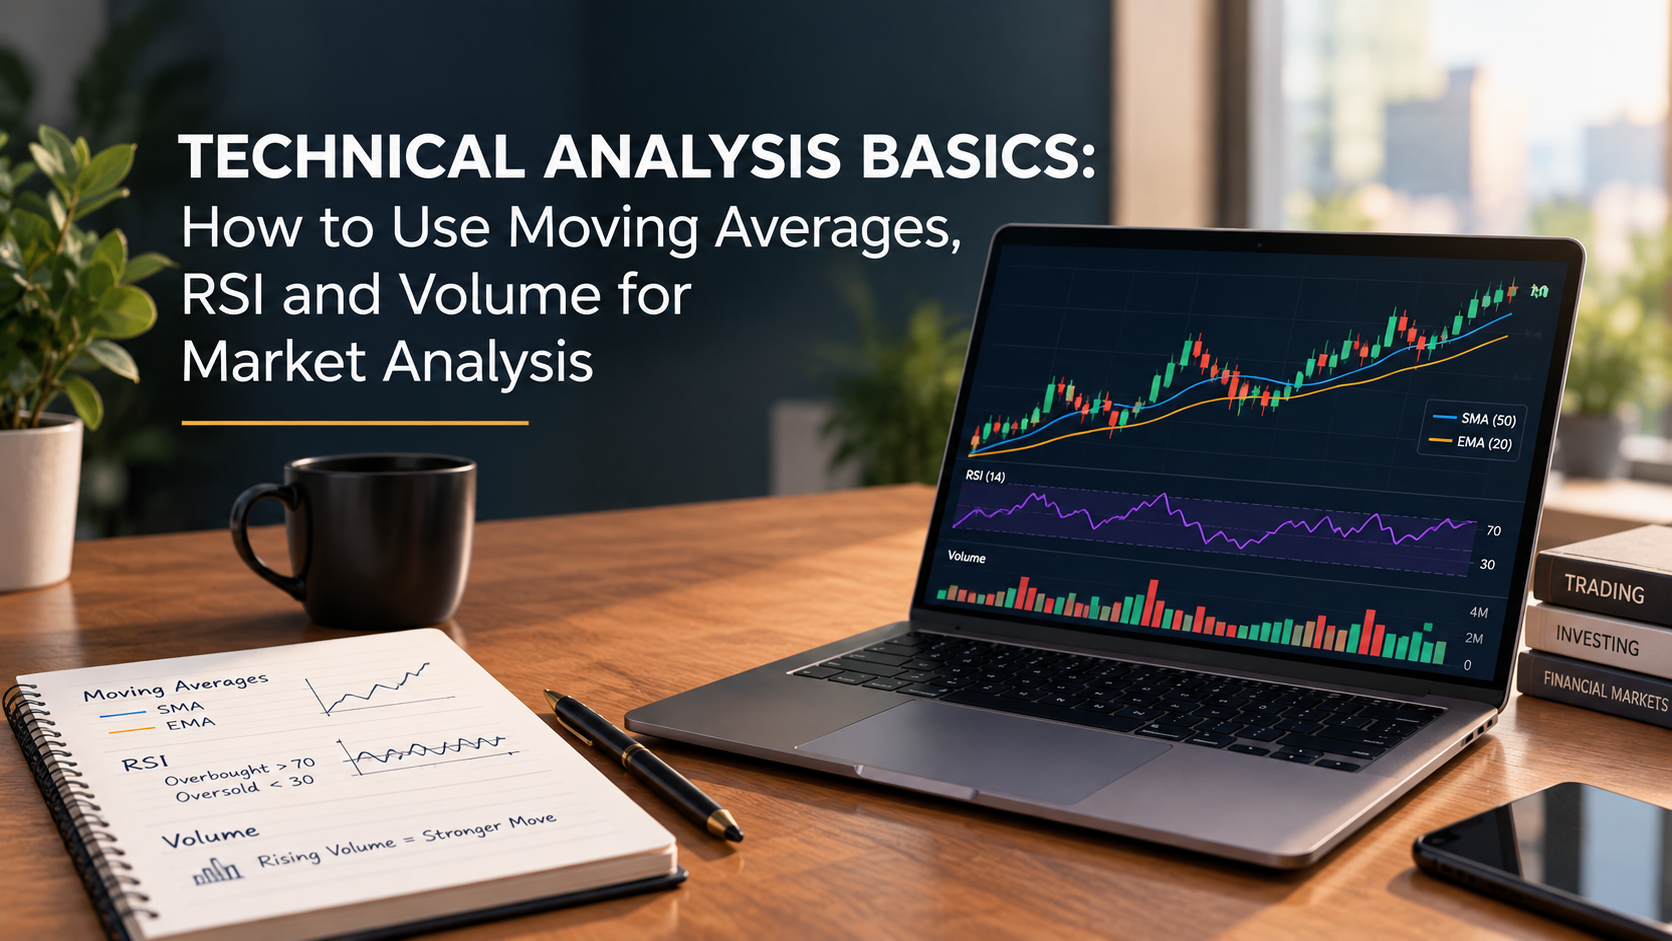

Understanding market movements is an important part of making informed investment decisions. Technical Analysis Basics can help investors study price trends, momentum, and trading activity by using historical market data. Three commonly used tools are moving averages, the Relative Strength Index (RSI), and volume.
For investors following the Indian Stock Market Today, these indicators can provide additional context when evaluating market trends. However, technical analysis works best as part of a broader research process rather than as a standalone method for making investment decisions.
What Is Technical Analysis?
Technical analysis involves studying historical price and trading-volume data to identify trends and potential market patterns. Instead of focusing primarily on a company’s financial statements, technical analysis examines how prices and market activity have behaved over time.
Investors tracking Stock Market Today India may use technical indicators to understand whether the broader market is showing upward, downward, or sideways momentum.
Technical analysis does not guarantee future market movements. Market conditions can change because of economic developments, interest rates, global events, investor sentiment, and other factors.
Understanding Moving Averages
Moving averages are among the most widely used technical indicators. They calculate the average price of an asset over a specific period and help smooth out short-term price fluctuations.
A shorter-period moving average generally reacts more quickly to recent price changes, while a longer-period moving average tends to provide a broader view of the trend.
Investors may compare the current price with a moving average to understand the prevailing trend. Moving averages can also be used together to identify changes in momentum. However, they are based on historical prices and may respond after a trend has already started.
For someone learning Technical Analysis Basics, understanding how different time periods affect moving averages is an important starting point.
How RSI Helps Measure Momentum
The Relative Strength Index, commonly known as RSI, is a momentum indicator that measures the speed and magnitude of recent price movements. It generally moves between 0 and 100.
RSI is often used to identify periods when market momentum may have become particularly strong in either direction. Traditionally, readings above 70 are often described as potentially overbought, while readings below 30 are often described as potentially oversold.
However, these levels should not automatically be treated as buy or sell signals. Strong trends can keep an indicator at elevated or depressed levels for extended periods.
Investors following Indian Sensex Today movements can use momentum indicators such as RSI alongside other forms of market analysis to develop a broader perspective.
Understanding the Importance of Volume
Volume represents the amount of trading activity taking place during a particular period. It can provide useful context about the strength of a price movement.
For example, a significant price movement accompanied by higher-than-usual volume may indicate stronger market participation. Conversely, a price movement occurring with relatively low volume may require additional analysis before drawing conclusions.
Combining price trends with volume can help investors understand whether market activity is increasing or decreasing.
Combining Moving Averages, RSI and Volume
Using multiple indicators together can provide a more comprehensive view than relying on a single indicator.
Moving averages can help identify the broader trend, RSI can provide information about momentum, and volume can offer insight into market participation. When these indicators point in a similar direction, investors may consider the information more meaningful, while conflicting signals can indicate uncertainty.
For example, an investor studying the Indian Stock Market Today might first examine the broader trend using moving averages, then review RSI to understand momentum and finally look at volume to assess trading activity.
The objective should be to interpret these indicators together rather than treating any individual signal as a guaranteed prediction.
Learning Technical Analysis in India
Beginners can develop their understanding through structured education and practical market observation. A Share Market Course Online can introduce concepts such as candlestick patterns, trend analysis, support and resistance, moving averages, RSI, volume, and risk management.
Following Stock Market Today India updates can also help learners connect technical concepts with actual market movements. At the same time, investors should understand that market information changes continuously and historical patterns do not guarantee future outcomes.
The concept of Best Stocks for Long Term also requires more than technical analysis. Investors with long-term objectives may need to consider financial performance, business fundamentals, valuation, industry conditions, diversification, and risk tolerance alongside technical indicators.
Conclusion:
Moving averages, RSI, and volume are useful tools for understanding different aspects of market behaviour. Moving averages can help identify trends, RSI can provide insights into momentum, and volume can show the level of market participation.
For investors researching the Indian Stock Market Today, learning these tools can improve their ability to interpret market data. Money Times provides financial information and educational content to help readers understand market concepts and investment-related topics.
Technical analysis should be used as one component of a broader investment process, with decisions aligned to individual financial goals, risk tolerance, and investment horizon.
Click here to know more about “IPO Investment Guide India: How to Evaluate New IPOs Before Investing.“


Leave A Comment